R 빌트인 파일 state.x77이라고 잇는뎅 이걸로 요인분석을 해보겟다
아니 님들 내가 25000파운드 내고 듣는 수업을 이렇게 공짜로 티스토리에 올려주면 개이득 아님?
내가 이해한 바로는 요인 분석의 목적이 데이터의 dimensonality 를 줄이는 것이자 방대한 원 관측치에서 관측되지 않은 주요 기저 요인을 나타내는 변수들의 조합을 찾아내는 것이다. 그게 뭔소리냐? 비슷한것들끼리 조합을해서 공통인자로 묶어내는것

일단 적합에 필요한 최적의 요인 수는 pca를 통해서 혹은 상관관계행렬의 고유값을 통해서 알 수 있다.
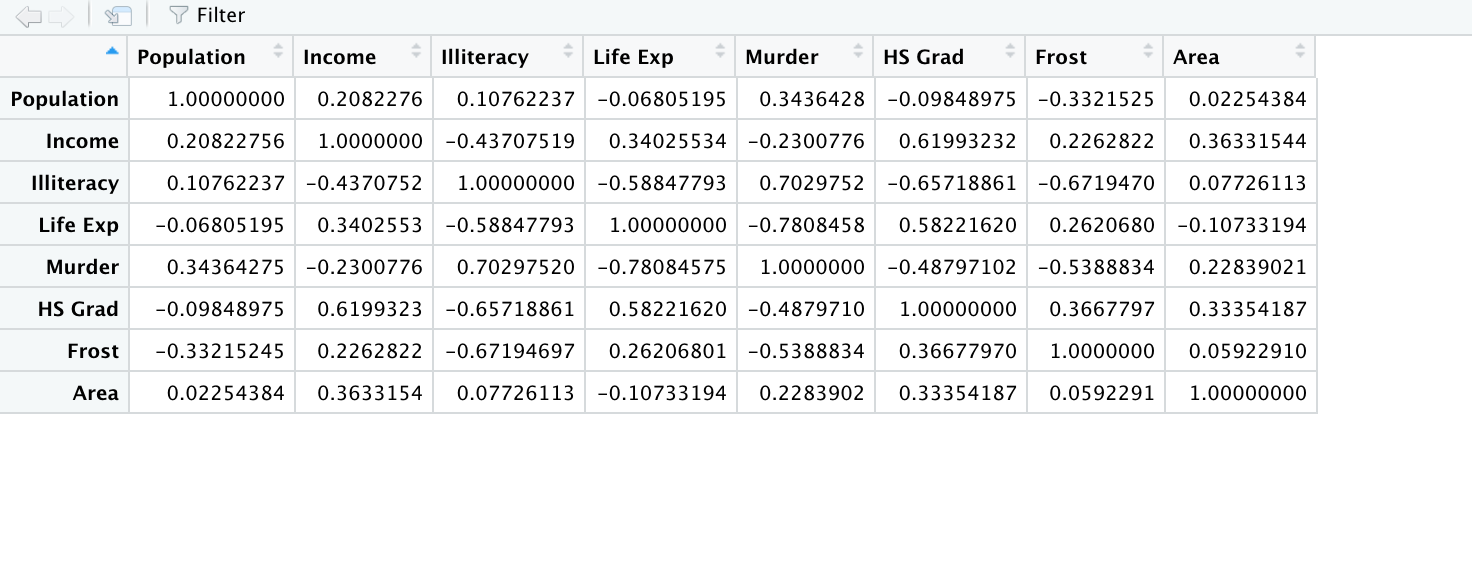
바쁜관계로 상관관계 행렬을 만들어보겟다
fa.cor <- cor(state.x77)
fa.eigen$values
sum(fa.eigen$values)
cumsum(fa.eigen$values)/8
plot(fa.eigen$values, type = "b", ylab = "Eigenvalues", xlab = "Factor")
여기서 원칙 고유값의 수는 변수의 수와 같다.
모든 고유값의 합은 변수의 수이다.
Rule 1. 교유값이 1을 넘는 변수를 알아냄으로써 주요 요인을 결정할 수 있다.
›3
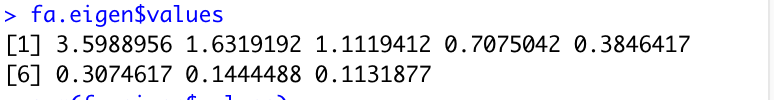
Rule2. 80퍼센트 어쩌구 누적고유값 cumulative eigenvalues라는 것이 있는데 누적시켜서 전체 변동의 80%를 만드는 푄트를 찾는 것이다.
고유값이 높다는 것은 그 변동이 큰 것임을 알 수 있습니다. 즉, Eigenvalue값이 높을수록 해당 구성요소가 데이터를 잘 설명한다고 볼 수 있습니다. Cumulative 열을 보면 각 고유값들의 합이 얼만큼의 변동을 설명하는가를 볼 수 있습니다.

여기서는 그러면 3을햇을때 거의 79%가넘으니까 3으로 ㄱㄱ
3. Cattell's Scree Plot
x축을 요인 y축을 고유값으로 한 플랏이다. 산처럼 생겼쥬? 오른쪽으로 갈수록 쭉쭉 떨어진다. 이런 드랍이 멈추고 커브가 완만~해지면 elbow굴곡이 생긴다 그 시점부터 오른쪽에 있는 팩터들을 버린다. 2아니면 5인듯한데 정확하지 않음 Rule 1 and Rule 2 suggest three factors. Rule 3 is less clear cut. We go with three.

fa.res <- factanal(x = state.x77, factors = 3, rotation = "promax")
print(fa.res, cut = 0.2)
요인을 3으로 뒀을 때 R함수인 factanal()을 사용해볼것이다!
promax는 많이 쓰이는 로테이션이다.

모형의 적합도를 봤을 때 null hypothesis : 3요인 모형이 sufficient 하다. 인데 이때 p 값이 0.05보다 작아서 귀무가설이 기각되고 결국에는 모형이 충분하지 않다.하지만 계속 돌려본다.
여기서 봐야될 것은 "로딩"이다....뭐가 설명력이 높은지...그리고 0.2가 넘는 것들만 프린트해본다. (유의한 로딩찾기) finding the significant loadings.murder의 경우는 factor1에 한해 아주높은 로딩인데, 2와 3에서는 0.2보다 작으므로 팩터 1에 의해 강하게 영향을 받는다 할 수 있겠다.
다음으로 factor score 를 찾아 보겠다. 2가지의 방법이 있다. 회귀방법과 바렛 방법. 바렛테스트 가보자구
fa.res <- factanal(x = state.x77, factors = 3, rotation = "promax", scores = "Bartlett")
head(fa.res$scores)
summary(lm(Factor1~Factor2, data = as.data.frame(fa.res$scores)))


이 스코어의 해석방법은 나도 잘 모르겠다. 일단 문제를 풀어보겠다. 궈궈!
Consider the data frame dataset1.txt available on Moodle which contains personality self reported measurements on 2,800 subjects. The measurements are:
• X1: Be indifferent to the feelings of others.
• X2: Inquire about others’ well-being.
• X3: Know how to comfort others.
• X4: Love children.
• X5: Make people feel at ease.
• X6: Be exacting in my work.
• X7: Continue until everything is perfect.
• X8: Do things according to a plan.
• X9: Do things in a half-way manner.
• X10: Waste my time.
• X11: Don’t talk a lot.
• X12: Find it difficult to approach others.
• X13: Know how to captivate people.
• X14: Make friends easily.
• X15: Take charge.
• X16: Get angry easily.
• X17: Get irritated easily.
• X18: Have frequent mood swings.
• X19: Often feel blue.
• X20: Panic easily.
• X21: Be full of ideas.
• X22: Avoid difficult reading material.
• X23: Carry the conversation to a higher level.
• X24: Spend time reflecting on things.
• X25: Will not probe deeply into a subject.
Perform a factor analysis on the provided dataset, summarising the main findings and discussing the results. Where applicable, justify your choices regarding the methodological settings used in your analysis.

factor1: x6,x7,x8,x9 these variables with strong loadings are all about work planning and taking control
factor2:x16,x17,x18 regarding easy mood swift
factor3: x1,x2,z3 regarding caring about others' feeling
factor4: x11,x12,x14,x15 being sociable, however x15 however not seem to be very relevant
factor5: dealing with people with conversation skills and idea
factor6: deep understanding,critical thinking
factor 7:
x24
factor 8: x4
factor 9: ...
factor 13: x3,x5
factor 14: x18,x19 emotion control
'Stat' 카테고리의 다른 글
| 충분통계량 (1) | 2023.12.10 |
|---|---|
| Exponential Family 지수족 (정규분포, 이항분포 증명) (0) | 2023.12.03 |
| Efficient Estimator 유효추정량 (0) | 2023.11.28 |
| Unbiased Estimator 불편추정량 (0) | 2023.11.28 |


